WAECMathematicsStatistics and Probability2023
WAEC Mathematics Practice Question
medium
Question:
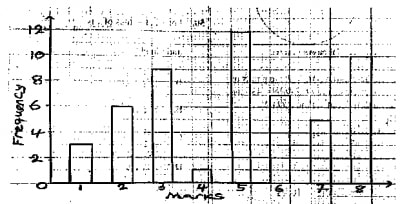
The bar chart represents the distribution of marks scored by students in an economics examination. Use the bar chart to answer questions 30 to 32 If the failed mark was 4, what is the probability that a student selected at random passed?
⚠️This question references a diagram that is not available. Use the AI Tutor for help.