JAMBEconomicsInflation and Unemployment2022
JAMB Economics Practice Question
medium
Question:
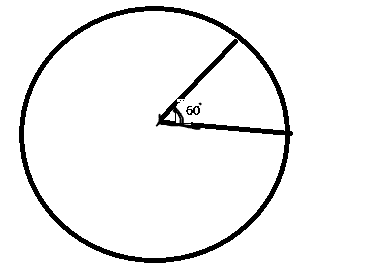
The pie chart above represents the total population of a school of 1,200. The shaded area of 60° shows the population of the underaged pupils. What is the population of the matured students?
⚠️This question references a diagram that is not available. Use the AI Tutor for help.