WAECMathematicsStatistics and Probability2021
WAEC Mathematics Practice Question
medium
Question:
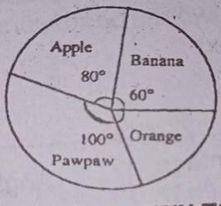
The pie chart represents the distribution of fruits on display in the shop if there are 60 apples on display how many oranges are there?
⚠️This question references a diagram that is not available. Use the AI Tutor for help.