WAECPhysicsThermal Physics2019
WAEC Physics Practice Question
medium
Question:
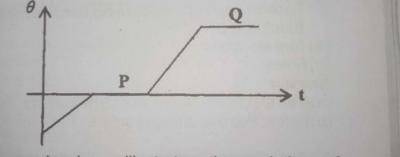
The graph above illustrates the variation of temperature with time (t) for a solid that is being heated. Which processes take place at segments P and Q respectively?
⚠️This question references a diagram that is not available. Use the AI Tutor for help.