WAECMathematicsStatistics and Probability2016
WAEC Mathematics Practice Question
medium
Question:
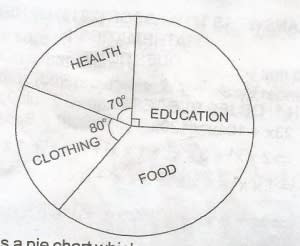
The figure is a pie chart which represents the expenditure of a family in a year. If the total income of the family was Le 10,800,000.00, how much was spent on food?
⚠️This question references a diagram that is not available. Use the AI Tutor for help.