WAECChemistryPhysical Chemistry2015
WAEC Chemistry Practice Question
medium
Question:
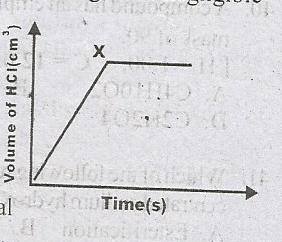
The following diagram illustrates the rate curve that was obtained when Mg reacted with excess dilute HCl. The diagram became horizontal at X because
The following diagram illustrates the rate curve that was obtained when Mg reacted with excess dilute HCl. The diagram became horizontal at X because