JAMBMathematicsStatistics and Probability2004
JAMB Mathematics Practice Question
medium
Question:
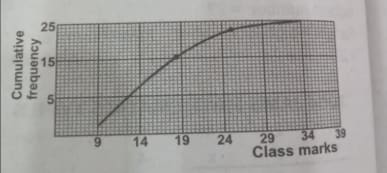
The graph above shows the cumulative frequency curve of the distribution of marks in a class test. What percentage of the students scored more than 20 marks?
⚠️This question references a diagram that is not available. Use the AI Tutor for help.