JAMBMathematicsCalculus1998
JAMB Mathematics Practice Question
medium
Question:
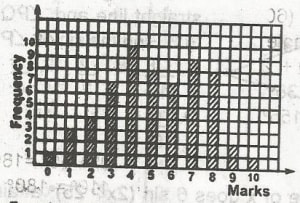
The bar chart shows the distribution of marks scored by 60 pupils in a test in which the maximum score was 10. If the pass mark was 5, what percentage of the pupils failed the test?
⚠️This question references a diagram that is not available. Use the AI Tutor for help.