JAMBMathematicsStatistics and Probability1983
JAMB Mathematics Practice Question
medium
Question:
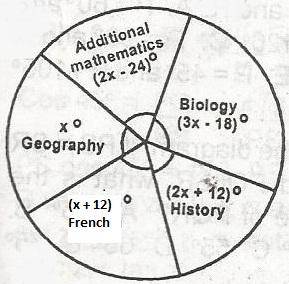
In a class of 60 pupils, the statistical distribution of the numbers of pupils offering Biology, History, French, Geography and Additional mathematics is as shown in the pie chart. How many pupils offer Additional Mathematics?
⚠️This question references a diagram that is not available. Use the AI Tutor for help.