WAECMathematicsStatistics and Probability2000
WAEC Mathematics Practice Question
medium
Question:
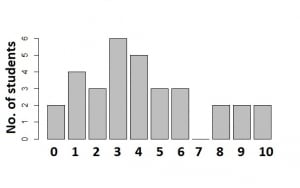
The bar chart shows the distribution of marks scored by a group of students in a test. Use the chart to answer the question below How many students scored 4 marks and above?
⚠️This question references a diagram that is not available. Use the AI Tutor for help.