JAMBMathematicsStatistics and Probability2004
JAMB Mathematics Practice Question
medium
Question:
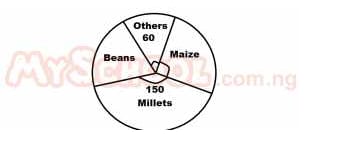
The pie chart above shows the distribution of the crops harvested from a farmland in a year. If 3000 tonnes of millet is harvested, what amount of beans is harvested
⚠️This question references a diagram that is not available. Use the AI Tutor for help.